case study: comparision of diffusion coefficient estimation methods
In this section the estimation of the diffusion coefficients are discussed. In 1 are listed experimental diffusion coefficients for general purpose poly styrene (GPPS) and high impact poly styrene (HIPS) for several migrants. These experimental values are compared to the diffusion coefficients estimated with the Piringer method 2, the Welle method 3 and the Brandsch method 4. Note the data in 1 is used to calibrate the Welle's coefficients a, b, c, and d for GPPS and HIPS.
Diffusion coefficients
The black line "1" is the perfect match of the estimated coefficients and the experimental coefficients. On the x-axis the experimental determined diffusion coefficient is noted in cm²/s. The y-axis shows the estimated diffusion coefficient in cm²/s.
Best value
The following two graphs show the best value version of the Piringer and Welle estimation and the estimation of Brandsch.

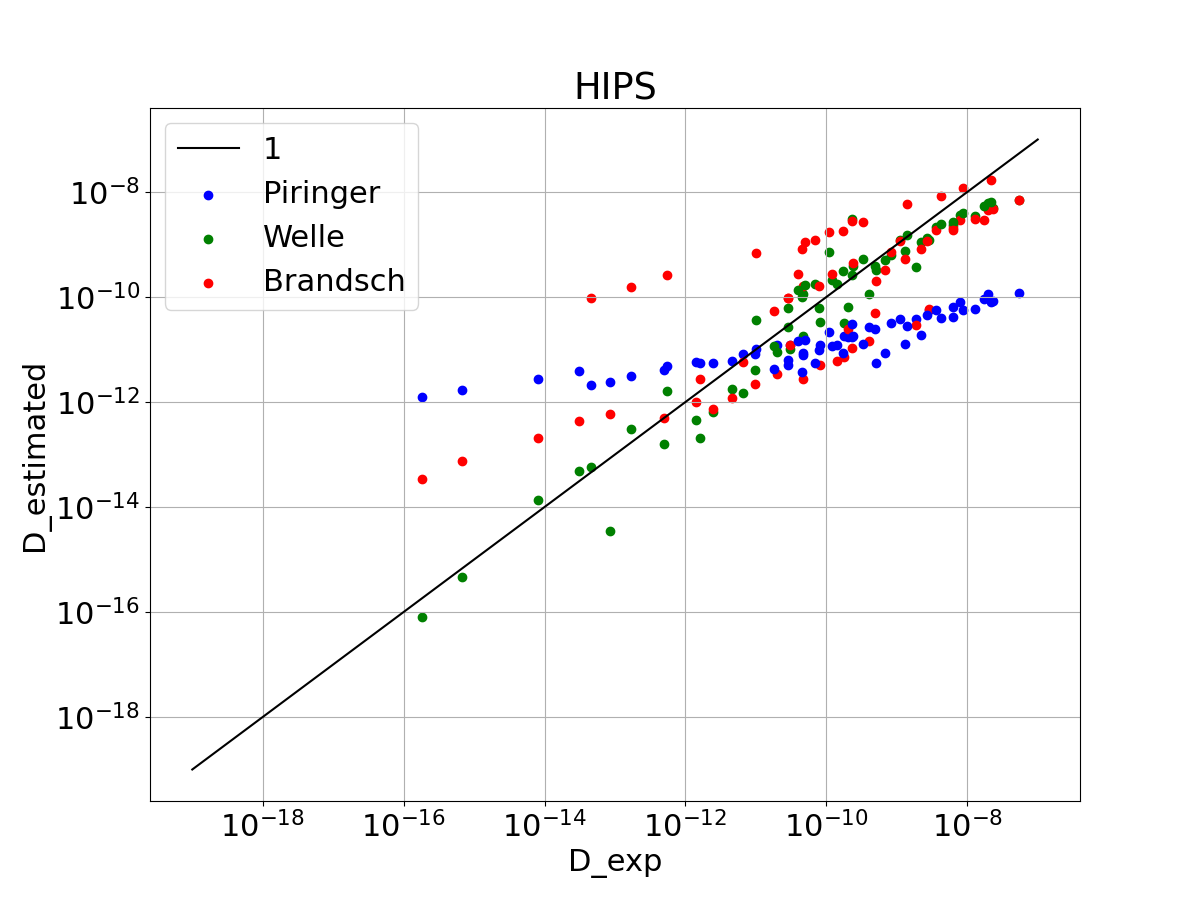
The Piringer estimation has a shallower slope than the idealised black line, which leads to an over estimation for low diffusion coefficients and an under estimation of high diffusion coefficients. The Welle estimation fits the black line well, with an increasing spread for higher diffusion coefficients for GPPS, which means the risk to underestimate the diffusion coefficients also rise with higher diffusion coefficients. For HIPS the Welle coefficients tends to underestimate the experimental coefficients. The Brandsch estimation performces for low diffusion coefficients slightly better than Piringer, for high diffusion coefficients the underestimation is much less than Piringer and slightly bigger than the Welle approach.
Upper limit
The following two graphs show the upper limit version of the Piringer and Welle estimation and the estimation of Brandsch.
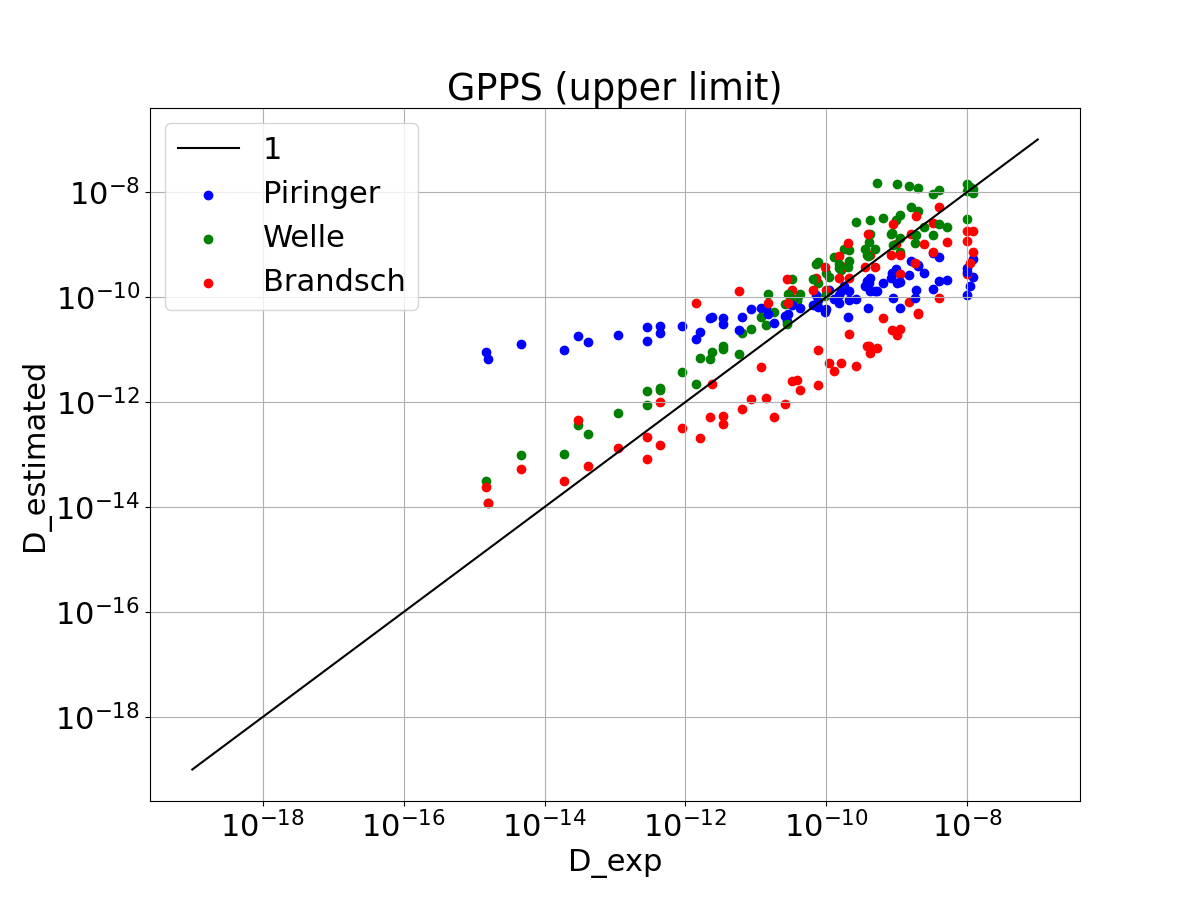
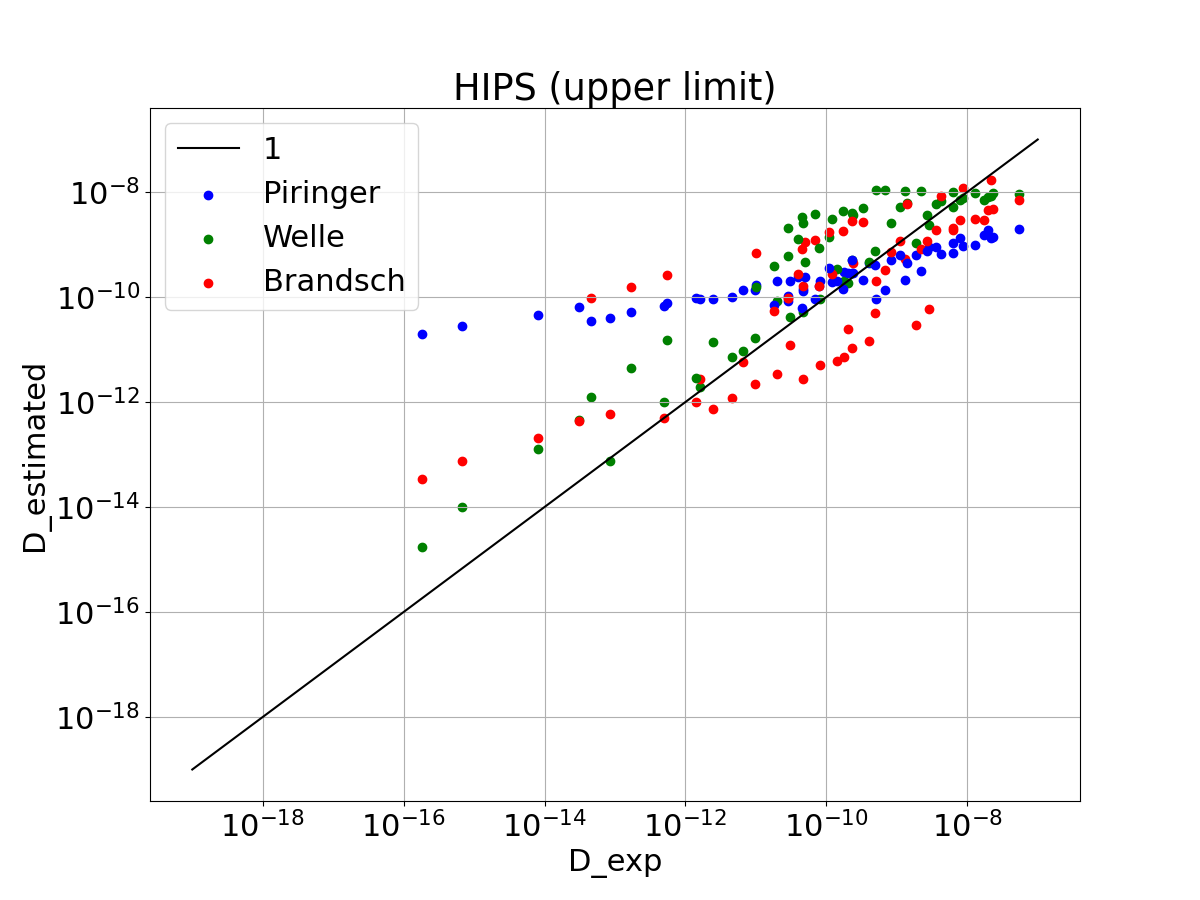
The Piringer coefficients are larger (because of a logarithmics transition of the parameters), which decreases the underestimation of high diffusion coefficients, but increases the overestimation of low diffusion coefficients. The underestimation of the Welle coefficients is parctically removed. The Brandsch coefficients are not changed.
Migration results
The above discussion is only based on the pure diffusion coefficients. The experimental migration result from 2 for GPPS and HIPS are used to compare the estimation procedures to make a more realistic test. The migration simulation is made with migraSIM. Unfortunately there are less experimental migration results, than experimental diffusion coefficients in 1.
The graphs show a comparision of the Piringer, Welle, and Brandsch diffusion coefficient estimation method. On the x-axis the experimental determined migration is noted in mg. The y-axis shows the simulation migration in mg.
Best value
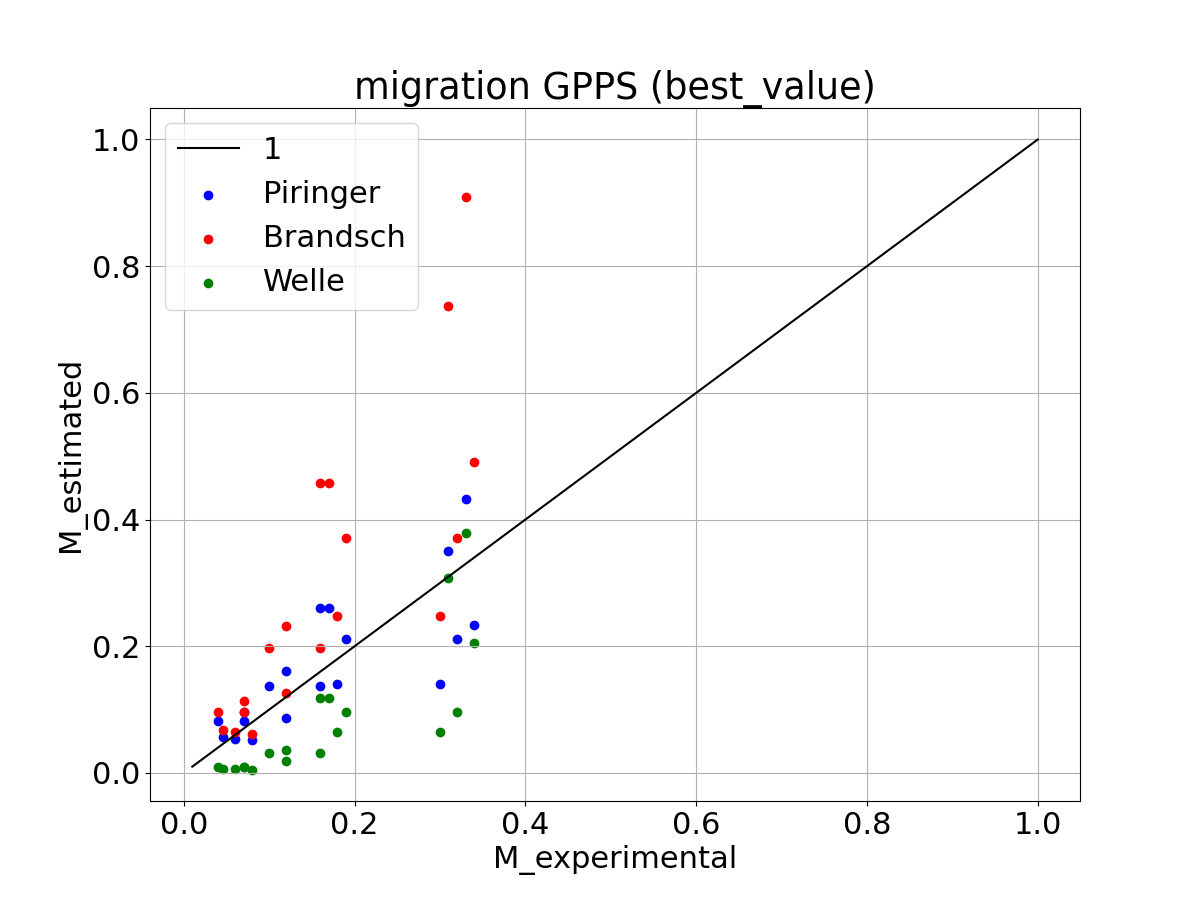
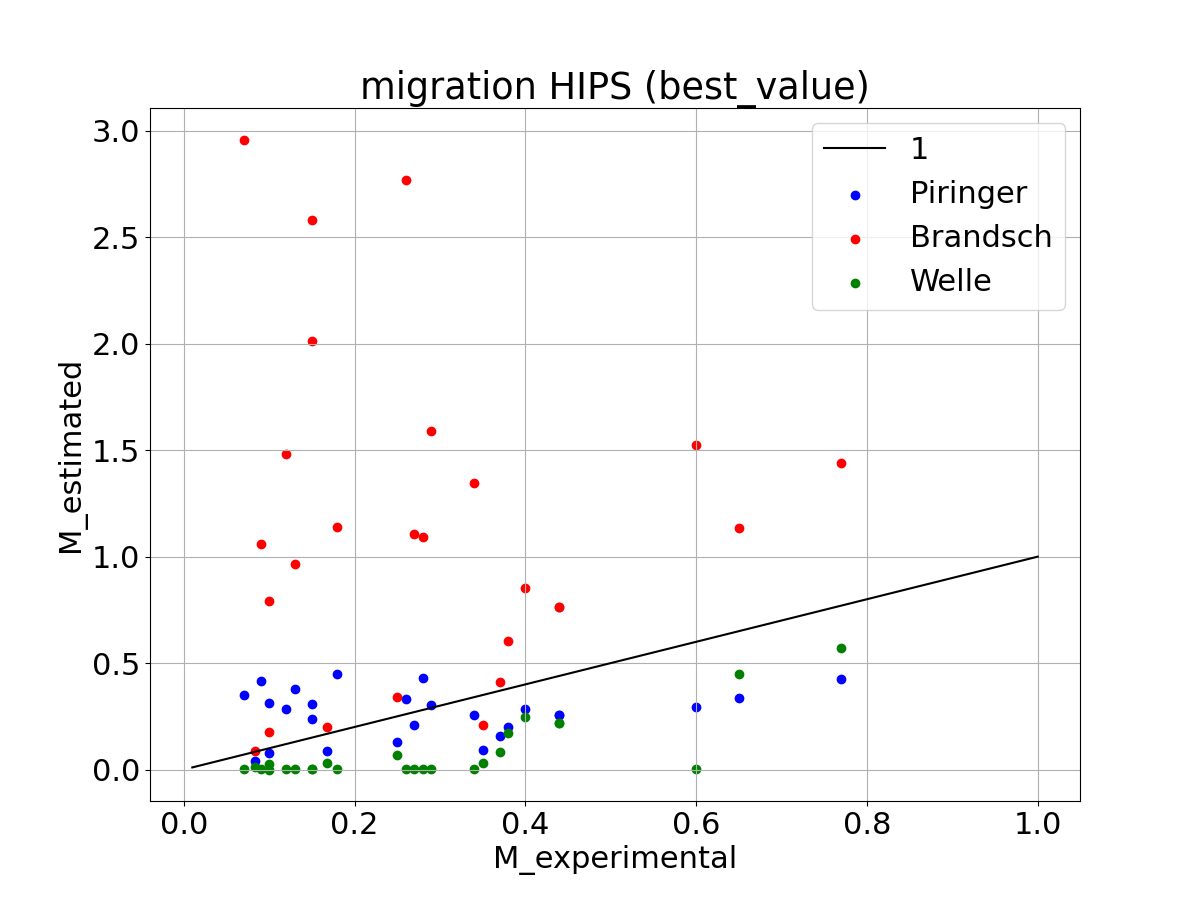
The simulation results with the Piringer estimation method scatter around the bisector, as expected (the Piringer parameters are trained with these data). The simulation results with the Welle estimation leads to an underestimation of the migration in nearly all cases, the Brandsch estimation results in overestimated simulations results.
Upper limit
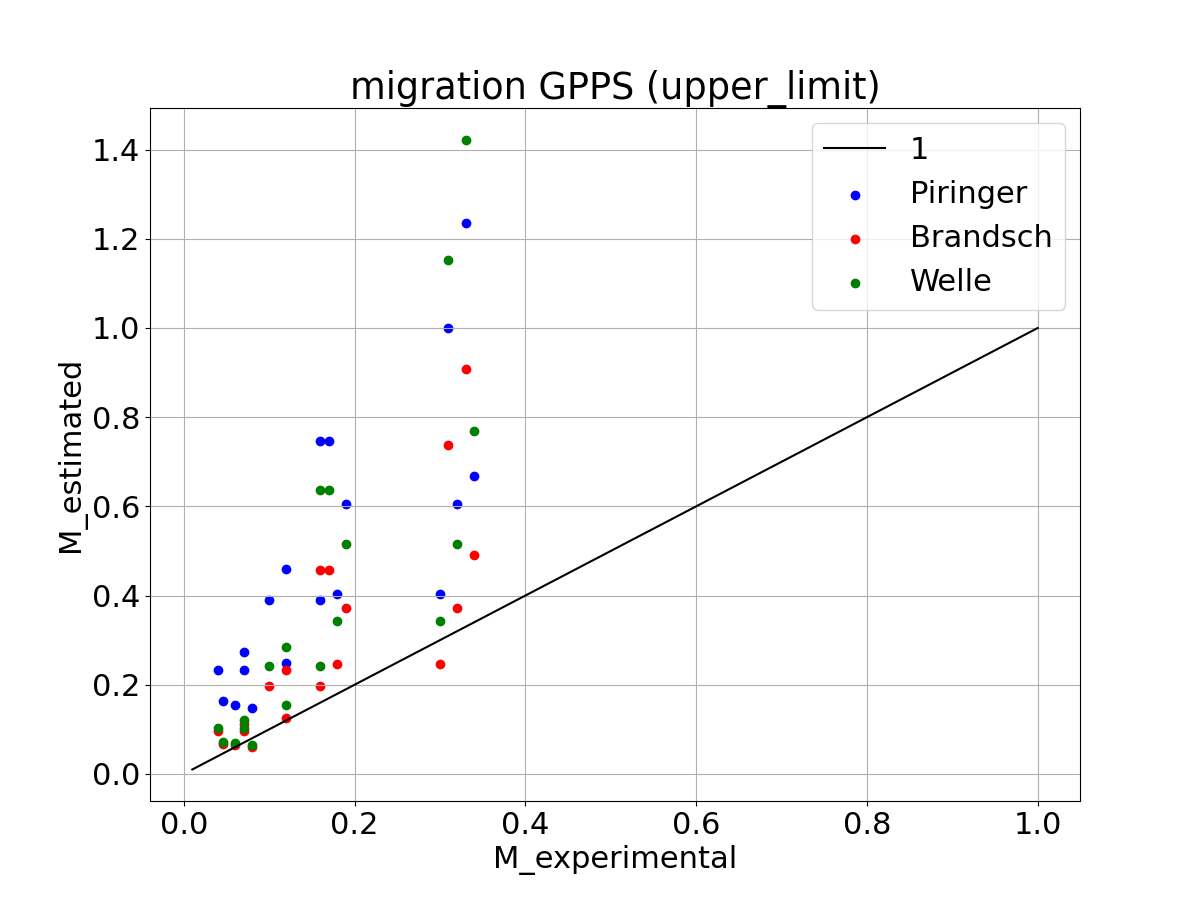
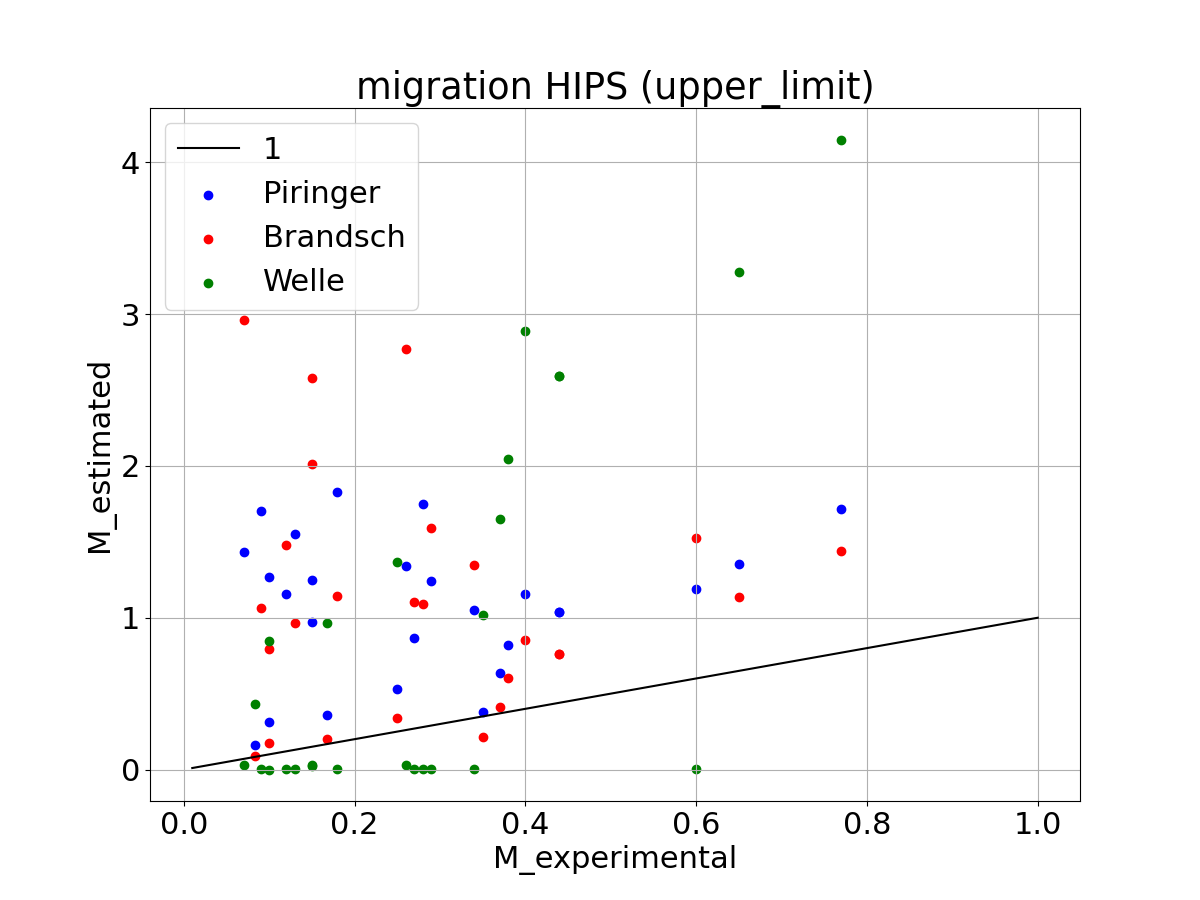
For the upper limit version of the Piringer estimation the parameters are calibrated so that the migration simulation leads to an overestimation compared to the experimental migration data. The some hold for the Welle estimation for GPPS. But for HIPS there is still an underestimation. The simulation values of the Brandsch estimation is not changed (still overestimating the experimental results).
-
Frank Welle. Diffusion coefficients and activation energies of diffusion of organic molecules in polystyrene below and above glass transition temperature. Polymers 2021, 13, 1317, 2021. URL: https://doi.org/10.3390/polym13081317. ↩↩↩
-
T. Begley, L. Castle, A. Feigenbaum, R. Franz, K. Hinrichs, T. Lickly, P. Mercea, M. Milana, A. O'Brien, S. Rebre, R. Rijk, and O. Piringer. Evaluation of migration models that might be used in support of regulations for food-contact plastics. Food Additives and Contaminants 22.1 (Jan. 2005), pp. 73-90., 2005. ↩↩
-
Frank Welle. A new method for the prediction of diffusion coefficients in poly(ethylene terephthalate). Journal of Applied Polymer Science, 2012. doi:10.1002/APP.38885. ↩
-
R Brandsch. Probabilistic migration modelling focused on functional barrier efficiency and low migration concepts in support of risk assessment. Food Additives & Contaminants: Part A, 34:10, 1743-1766, 2017. doi:10.1080/19440049.2017.1339235. ↩